An update to the ASP.NET Core & Angular2 series
Jürgen Gutsch - 18 April, 2016
There was a small but critical mistake in the last series about ASP.NET Core and Angular2. Debugging in the Browser is not possible the way I configured the solution. Fortunately it is pretty simple to fix this problem.
Modern web browsers support debugging typescript sources while running JavaScript. This is a pretty useful browser magic. This works, because there is a mapping file, which contains the info about which line of JavaScript points to the specific line in the TypeScript file. This mapping file is also created by the TypeScript compiler and stored in the output folder.
In my blog series about ASP.NET Core and Angular2, I placed the TypeScript file in a folder called scripts in the root of the project, but outside the wwwroot folder. This was a mistake, because the browsers found the JavaScript and the mapping files, but they didn't find the TapeScript files. Debugging in the browser was not possible with this configuration.
To fix this, I copied all the files inside the scripts folder to the folder /wwwroot/app/
I also needed to change the "outDir" in the tsconfig.json to point to the current directory:
{
  "compilerOptions": {
    "emitDecoratorMetadata": true,
    "experimentalDecorators": true,
    "module": "commonjs",
    "noEmitOnError": true,
    "noImplicitAny": false,
    "outDir": "./",
    "removeComments": false,
    "sourceMap": true,
    "target": "es5"
  },
  "exclude": [
    "node_modules"
  ]
}
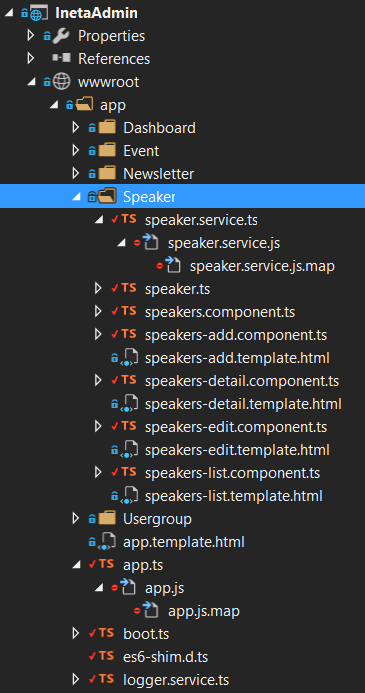
The result looks like this now:

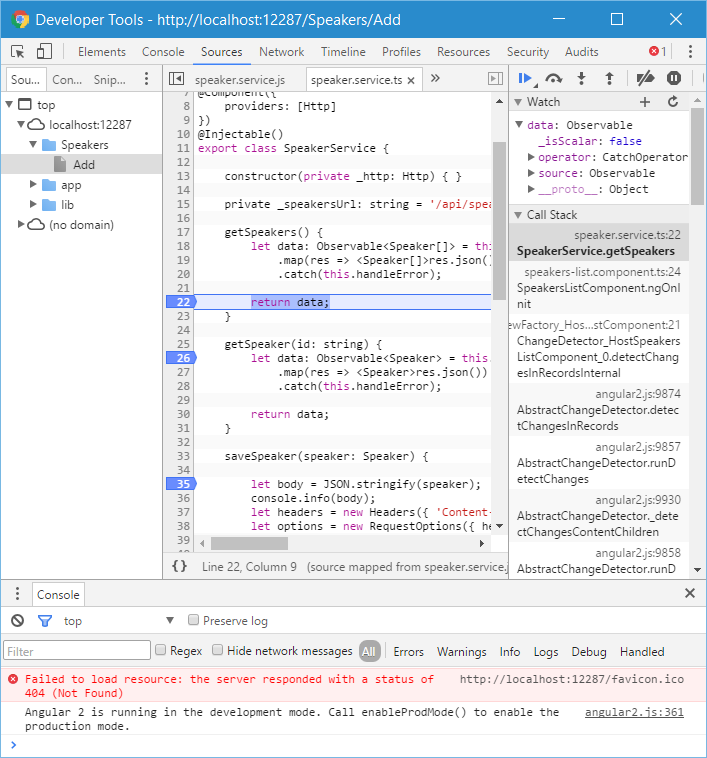
My first Idea was to separate the sources from the output, but I forgot about client side debugging of the TypeScript sources. By making the TypeScript file available to the browsers, I' now able to debug TypeScript in the browsers:

Thanks to Fabian Gosebrink, who points me to that issue. We discussed about that, when we was on the way to the Microsoft Community Open Day 2016 (COD16) in Munich this year.
